Showing posts with label CUDA. Show all posts

Wednesday, August 21, 2019

Ryne

I just released a tech demo of Ryne, my game-engine-to-be. You can find more information and media on the Ryne Engine website.

Ryne is an experimental voxel pathtracer. You can try the tech demo yourself to see if it runs on your PC.

In the future I will release the C# scripting side open source. This will allow you to change most of the engine features yourself. You can see an overview of the functionality currently included in that project here


Why “release” it now?

I don’t want to create endless videos about a new technology that you will have to believe is real. Instead I’d like to include as many of you as possible while Ryne is in development. I know Ryne still has flaws and is nowhere near as usable as I want it to be, but I’m still convinced that putting out tech demos like these will bring the point across that we will get there eventually. This will both help me focus on the most important issues, and make everyone aware this is no longer a dream, but we can actually render something right now.

I’m trying to keep a stream of releases going out whenever I feel a new set of features or bug fixes are good to go.

If you’d like to discuss or have more questions, feel free to join the discord server.

Thursday, July 6, 2017

Automated marshalling of managed- to unmanaged structures

An art that I wouldn't even wish upon my greatest enemies to figure out.

I recently started a new project in a language very familiar to me: C#, a managed language. This means that all the memory management is done for you, which is both a blessing and a curse. For this project, I happened to struggle over the "curse part" of automatic memory management.

The problem I encountered is as follows: when you have two structures that are identical in terms of their members, their respective sizes can (and often will) differ in managed languages compared to unmanaged languages. For example, I have the following structure in C# and C++ respectively:

// C#
[StructLayout(LayoutKind.Sequential)]
struct DebugComponent
{
    public float4 Float4;
    public float Float;
}

// C++
struct CPP_DebugComponent
{
    float4 Float4;
    float Float;
};

The size of the structure can be found in C# by using Marshal.SizeOf() (or sizeof() in unsafe code) and reports that the structure is 20 bytes in size, which is correct. Note that I already applied the StructLayout to Sequential, as this will create a layout similar to unmanaged code.

The size of the same structure in C++ using sizeof() reports that the structure is 32 bytes. This is also correct, because the float4 type here is aligned to 16 bytes, meaning the structure will receive another 12 bytes of padding at the end, to make sure it aligns with 16 bytes.

Unfortunately trying to use this structure in a tool such as ManagedCuda, the CUDA kernel struct will use the C++ version, and when you call the kernel from your C# code you will have to use the other version. This creates a mismatch in memory layout, resulting in very weird artifacts after running the kernel, or even crashing because you're writing to unallocated memory in this case.

The "simple" solution I found is to manually expand the C# structure by using the StructLayout.Size attribute to extend the structure to 32 bytes instead of 20. After asking my question on StackOverflow, I didn't solve the problem to create these structures automatically without counting the sizes of every individual type in the structure itself.

So I had to switch up my solution a little bit. I created a project which contains the raw C# structures that I want to use, along with all their functionality like loading and serialization. I then created another C# project for the automated code generation. Using this project we can load our Structures as a dll, from which we can derive all the structures and what types they contain in text templates:
  • Structures: project that contains raw structures that will be used on the GPU
  • Tools: my general purpose project that will generate GPU versions of the structs defined in Structures.
In order to make this conversion as secure as possible I don't want to manually check every time I create a new structure if the GPU version has the same alignment and size. So I created two more projects:
  • AlignedStructsWrapper: A C++/CLI project that combines managed and unmanaged code
  • Tests: a unit test project
Using the CLI project, we can load both our versions of the structure: the managed C# version and the unmanaged C++ version. We can now measure the difference in their sizes:

public ref struct WrapperGpuDebugComponent
{
public:
 int SizeDiff()
 {
  int managedSize = sizeof(Tools::Content::Generated::DebugComponent);
  int nativeSize = sizeof(CUDA::CPP_DebugComponent);
  return managedSize - nativeSize;
 }
};

In the unit test project we load our CLI from reference and we can create a simple unit test that calls the SizeDiff function and checks if the difference is indeed 0:

[TestMethod]
public void CheckStructureSizes()
{
 WrapperGpuDebugComponent debugcomponent = new WrapperGpuDebugComponent();
 Assert.AreEqual(debugcomponent.SizeDiff(), 0);
}

Of course I also generated the CLI structures and the unit test functions automatically for every structure so I only have to recompile the projects and have everything tested.

Sunday, May 14, 2017

CUDA in Visual Studio 2017

Edit: CUDA 9.0 RC is released. This version shows full Visual Studio 2017 support.

Note: this article only shows how to compile Visual Studio 2015 CUDA projects in Visual Studio 2017. For actual VS2017 support we will have to wait for a new CUDA release.

I previously wrote a small article on CUDA support for VS2015, to support CUDA compilation of older projects. Following the same principle we can 'hack' CUDA compilation support in VS2017. 

What you need
  • CUDA installation with visual studio integration for VS. I used CUDA 8.0 and VS2015 respectively.
  • VS2017 (any edition)
Copying the required files
  • To allow CUDA compilation we have to copy a few files. Find the CUDA 8.0 setting files in the VS2015 buildcustomizations directory:
C:\Program Files (x86)\MSBuild\Microsoft.Cpp\v4.0\V140\BuildCustomizations
Note: If you use a different VS version, you have to change the 'V140' accordingly (V120 for VS2013 for example).
  • Copy the following files: CUDA 8.0.props, CUDA 8.0.targets, CUDA 8.0.xml, and Nvda.Build.CudaTasks.v8.0.dll
  • Find the VS2017 buildcustomizations directory:
C:\Program Files (x86)\Microsoft Visual Studio\2017\Community\Common7\IDE\VC\VCTargets\BuildCustomizations
Note: I used the VS2017 Community edition. If you have another edition, change 'Community' in the path accordingly.

  • Paste the CUDA files here.

That's it
You can now load and compile your VS2015 CUDA projects in VS2017. When you first open your project in VS2017, make sure to not upgrade your project to VS2017, otherwise this won't work. 

Saturday, April 22, 2017

Master Thesis

Update: You can download the full thesis here.

Level-of-Detail Independent Voxel-Based Surface Approximations was the subject of my master thesis. I wrote a small dissemination that explains the basics of my thesis on this page.


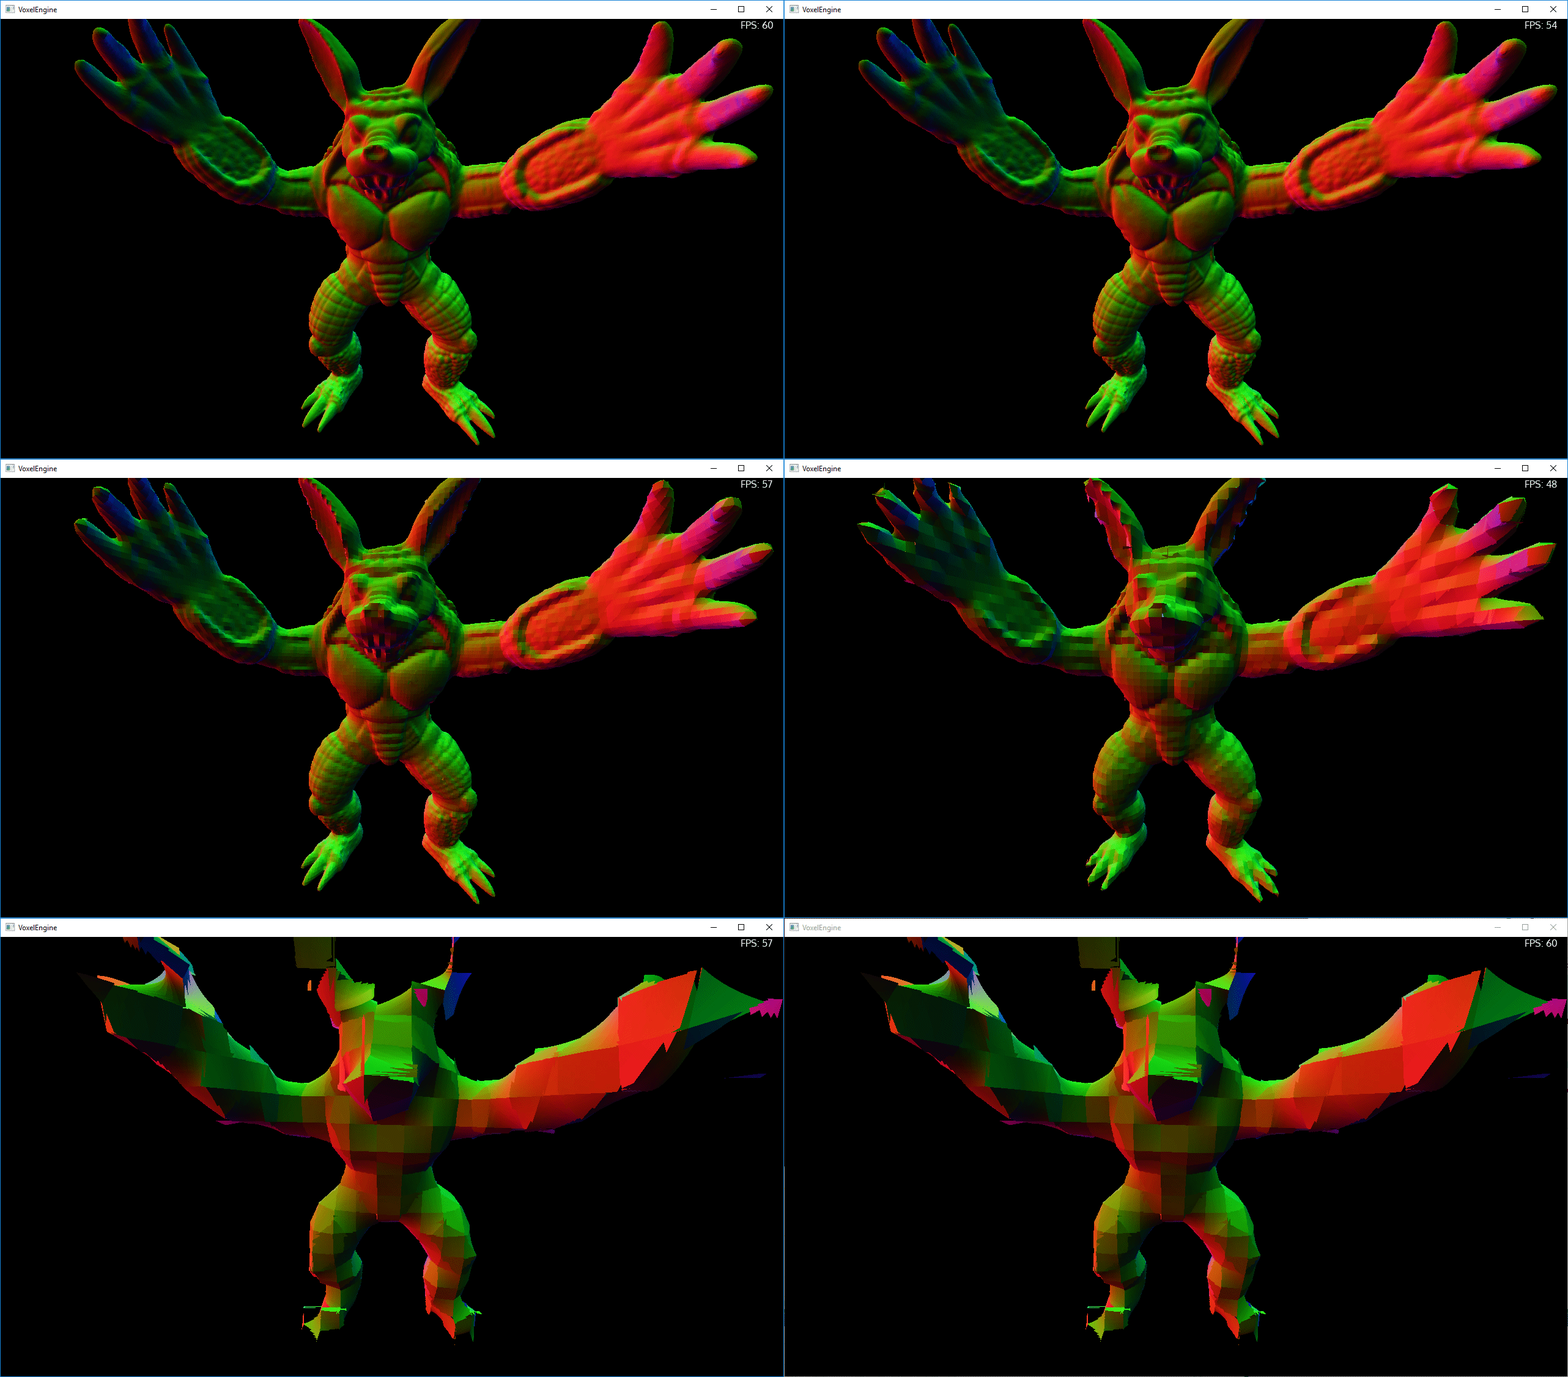
This image shows the final result of my thesis work. The models above are voxel models with 4096 (2^12) voxels in every axis. If they were all filled, I would have to store 4096^3 = 68719476736 voxels in total. There has been a lot of research into compressing the huge amount of data this requires, I mentioned some examples on the thesis page.

Using a Sparse Voxel Octree (SVO) storing scalar field values, the six models above can be stored in 12GB of memory total. Using my multiresolution method we can store visually comparable models in only 2GB of memory total.

Here is a small video showing the current state of the voxel path tracer:


Thursday, October 27, 2016

Master thesis current state

For my master thesis, I've been working on a project for some time now. In this post I'll share a few debug screenshots of the current state of the project.


The project can load triangle meshes of (almost) any format, and convert them to large resolution sparse voxel octrees (SVO). In the picture above, you can see the voxelized Lucy model, which is about 500MB in triangle format.

Converted to an SVO, storing only which voxels are on or off, we can store data for up to 4096^3 voxels in only ~40MB. That's a boolean for ~68 billion voxels. But since we only store voxels that are on, this number changes drastically, thus we are able to compress this pretty well.

If you want to store more data for every voxel, the amount of memory is going to skyrocket. In the example above, I store a scalar field for every voxel (that's 8 floating point numbers per voxel). All that data nets nearly 870MB for the highest resolution.

I was able to convert and draw a model up to 8192^3 resolution, including all simplifications of a dragon model:


Where you can see that the voxel resolution is even larger than the millions of triangles stored in the model.

For my master thesis I will be working on creating level of detail simplifications. The screenshots below show some results of a linear approximation calculated for a group of voxels:


The first model at 512^3 resolution, and the second at 2048^3.

These images are rendered using raymarching to find the intersection point of a ray and a scalar field. I wrote the raytracer in CUDA, which allows for an interactive framerate even with gigantic data sets by using parallelization on the GPU.

Finally, some more renders:


Thursday, February 25, 2016

CUDA in Visual Studio 2015

Update September 2016: CUDA 8.0 is available, Visual studio update 3 is supported.
Update June 2016: CUDA 8.0 RC is available. Visual studio 2015 is supported, but update 2 is not yet included.

In this small post I will explain how you can use CUDA 7.5 in Visual Studio 2015. I don't claim to have full support for VS2015, merely using the VS2015 editor and compiling a VS2013 project. You will still need to have Visual Studio 2013 installed, with the CUDA toolkit extension.

On a separate note: Nsight does have support for VS2015, so no hacks required there!

What you need:

  • Any C++ project using CUDA.
  • CUDA 7.5 toolkit with VS2013 support installed (I only tested it with 7.5, but I can imagine other versions working as well)

In the project properties, make sure the project compiles for "v120", which is VS2013. 

To actually load the project in VS2015 having support for compiling CUDA code, we have to copy some files. Visual Studio uses targets to include several extensions for loading project files. We simply have to copy the VS2013 support to the VS2015 folder:

The CUDA 7.5 extension files for VS2013 are located in:
C:\Program Files (x86)\MSBuild\Microsoft.Cpp\v4.0\V120\BuildCustomizations

Find CUDA 7.5.props, CUDA 7.5.targets and CUDA 7.5.xml

If you simply copy them to the same folder for VS2015:
C:\Program Files (x86)\MSBuild\Microsoft.Cpp\v4.0\V140\BuildCustomizations

You can now load these projects in VS2015. 


My raytracer running from VS2015 using Nsight. 

Saturday, December 5, 2015

Real-time Raytracing part 3.1

In part 3, I've shown some examples on how to tune algorithms on the GPU. Here I would like to address how we can apply those rules to optimize path tracing. As usual, I will show code samples for CUDA, but this doesn't mean it can't be applied on any other graphics programming language.

Fortunately for us, there is an opensource framework for optimized GPU based ray traversal. The framework is from the research paper Understanding the Efficiency of Ray Traversal on GPUs. In 2012 they added Kepler and Fermi Addendum, which added some changes to the framework to optimize traversal for those architectures. In this post I will be looking at the version for the kepler architecture. The framework is quite heavy on magic numbers and hard to read code. In this post I'm going to dissect some of the more important parts and how they improve performance.

Data structures

The first thing to notice is what kind of spatial data structure they are using. From the name of the class: "SplitBVHBuilder" you can already see that the builder is based on this paper. It comes down to a simple binned BVH builder, including triangle splits to optimize traversal. For more information on BVH techniques, you can read part 2 of this series.

More important for this post is how you store this BVH on the GPU and access it without creating any memory latency. If we look at the ray traversal, the following code shows how the nodes are read from memory:

    const float4 n0xy = tex1Dfetch(t_nodesA, nodeAddr + 0); // (c0.lo.x, c0.hi.x, c0.lo.y, c0.hi.y)
    const float4 n1xy = tex1Dfetch(t_nodesA, nodeAddr + 1); // (c1.lo.x, c1.hi.x, c1.lo.y, c1.hi.y)
    const float4 nz   = tex1Dfetch(t_nodesA, nodeAddr + 2); // (c0.lo.z, c0.hi.z, c1.lo.z, c1.hi.z)
            float4 tmp  = tex1Dfetch(t_nodesA, nodeAddr + 3); // child_index0, child_index1
            int2  cnodes= *(int2*)&tmp;

Recalling from part 3, I showed you a similar statement for memory alignment using the fact that arrays in global memory didn't have data fragmentation. Reading memory from a texture using this principle is more natural, because textures ensure no data fragmentation. As seen in the comments above, the information gathered contains two BVH bounding boxes and two child indices. Storing the data this way ensures you have four 128 bit reads and one 64 bit read, since the last two values are unused.

The other data structure I would like to point out is the way they store triangles. The nodeaddr variable can store either positive or negative values. The positive indicate an index in the BVH and negative values store indices to the triangle array. The actual index is found by using the bit negate function ($\sim$) on the index. From this address they fetch the triangle using similar code as above:

    // Tris in TEX (good to fetch as a single batch)
    const float4 v00 = tex1Dfetch(t_trisA, triAddr + 0);
    const float4 v11 = tex1Dfetch(t_trisA, triAddr + 1);
    const float4 v22 = tex1Dfetch(t_trisA, triAddr + 2);

In which you can store the data required for a ray-triangle test and execute it. The thing to note is: BVHs can store more than one triangle per node, especially SBVHs. In order to store this efficiently in one array, they inserted breaks in the array. The code for checking all triangles:

for (int triAddr = ~leafAddr;; triAddr += 3)
{
 // Read triangle data (see above)

    // End marker (negative zero) => all triangles processed.
    if (__float_as_int(v00.x) == 0x80000000)
        break;

 // Ray-triangle intersection (see part 1)
}

The for loop determines the triangle address and loops endlessly increasing the triangle address. If the first address contains a stop value (they chose for negative zero, but any distinguished value will do), stop the for loop. Simple as that, the array can now contain more than one triangle per node.

Traversal algorithm

The traversal algorithm is as follows: beginning this algorithm assumes the ray hit the BVH containing the model we wish to test for. If it didn't, it's not that bad, after two ray-box intersections the algorithm stops.

  • Starting from the first node address, we read the first two child bounding boxes using the code above
  • Using the optimized intersection test for the GPU from the paper, we test ray-box intersections.
  • If the ray intersects one of them, we change the node address and continue the algorithm. 
  • If we intersect both children, store one of the children on the stack and continue traversing the other.
  • If we intersect none, pull a child index from the stack. If the stack is empty, stop the algorithm.
While this algorithm is pretty easy to implement, optimizing it for the GPU is quite a hassle. In order to minimize divergence, they thought of two neat tricks to alter this algorithm. The first trick is persistent threads. This concept originated from the following thought: A warp will execute until all threads inside it are done processing. In a path tracer like ours this can lead to horrific situations: 31 threads waiting for just the one to be done tracing.

The idea to combat this is quite simple: if there are less than X threads active, fetch new work for the idle threads. Using older graphics hardware, the implementation would take some time for all threads to communicate their status using shuffle functions. Since kepler architecture there are some warp voting functions introduced. From the CUDA toolkit:
__all(predicate):
Evaluate predicate for all active threads of the warp and return non-zero if and only if predicate evaluates to non-zero for all of them.
__any(predicate):
Evaluate predicate for all active threads of the warp and return non-zero if and only if predicate evaluates to non-zero for any of them.
__ballot(predicate):
Evaluate predicate for all active threads of the warp and return an integer whose Nth bit is set if and only if predicate evaluates to non-zero for the Nth thread of the warp and the Nth thread is active.

Which comes in very useful for this task. The code that remains to execute this test:
if( __popc(__ballot(true)) < DYNAMIC_FETCH_THRESHOLD )
                break;
Where __popc is a population count, counting the number of bits equal to 1 from the provided value.

The other trick in the algorithm to minimize divergence is part of triangle checking. It comes down to timing: when to check for triangles. In theory, the threads in the warp could be divergent: one thread checking ray-triangle intersections and the others traversing the BVH. While this is not completely preventable, we could help the algorithm postpone checking triangles until all threads have at least one triangle to check.

By creating an array (or in this case a variable) to store a triangle address, we can continue traversing the BVH until other threads have also found a triangle. The code in the source uses a direct compiled statement to check this, since it wouldn't be compiled in an optimal way. The code that you would need to check if all threads have a triangle is simple:
    if(!__any(leafAddr >= 0))
        break;
Where leafAddr indicates a triangle address. The statement simply checks if there is a thread for which the address is larger than or equal to 0. If there are none, it means all threads have found a triangle to check and we can stop traversing the BVH.


I hope to have cleared up some of the magic parts of the source code. Of course, if you have any more questions about it, feel free to post them below.

Saturday, November 21, 2015

Real-time Raytracing part 3

In part 2, I showed you that you can speed up your ray tracing algorithm by means of a spatial data structure. In this post I would like to address optimizing GPU code using CUDA. Below, I give some general tips to boost parallel performance. Be aware that these points will not always be relevant. I will explain why, and under which conditions these points can optimize your algorithm:
  • Try to avoid divergent statements and recursive algorithms. 
  • Keep track of memory alignment for reads and writes of large datasets. 

Divergence

Why is this so important? Most of the performance issues can be devoted to divergence. To explain divergence, I'm going to show a simple example. Say we want to multiply all even numbers by 2, and divide all uneven number by 2. A simple parallel reduction creates us the following:
__device__ void divergent(int* array, int nNumbers)
{
   int idx = threadIdx.x + blockDim.x * blockIdx.x;

   for (int i = idx; i < nNumbers; i += blockDim.x*gridDim.x)
   {
     if (array[i] % 2 == 0)
       array[i] *= 2;
     else
       array[i] /= 2;
   }
}

CUDA can run thousands of threads in parallel, but it comes with a small trick called warps. These warps also exist in other GPU specific languages like OpenCL or compute shaders, but they are referred to as wavefronts. CUDA launches a set of 32 threads as one simultaneous bunch called a warp. Here is step by step what happens while executing one warp:

  1. The 32 threads each calculate their respective idx.
  2. The starting point of the for loop is the same as idx.
  3. The first conditional statement: all of the threads for which this statement is true (16 threads) will execute, the other threads (16) are idling.
  4. The second conditional statement: same as the first, only the other way around.
  5. Increase the loop index, and repeat from 3 until the end of the loop.

In total we've just executed the same amount of statements as in a serial variant of this algorithm. However, the serial variant does not have any idle time. If you would sum the total time spent executing this algorithm for both variants, the serial algorithm would take less total time than this parallel variant. Simply because half of the threads are idling all the time!

This is where the term divergence originated from: divergent statements blocking full parallel execution in warps or wavefronts. In the example above, we have at maximum 50% divergence, meaning half of the threads follow a different path than linear code execution. So, how do we get the algorithm from above to execute in parallel without divergence? Fairly simple:
__device__ void divergent(int* array, int nNumbers)
{
  int idx = threadIdx.x + blockDim.x * blockIdx.x;

  idx *= 2; // All even numbers
  for (int i = idx; i < nNumbers; i += blockDim.x*gridDim.x*2)
    array[i] *= 2;

  idx++; // All uneven numbers
  for (int i = idx; i < nNumbers; i += blockDim.x*gridDim.x*2)
    array[i] /= 2;
}

By removing the divergent statements, we get code that leaves no thread idling. Of course this was a simple example, and there are many branching statements which are impossible to solve the same way as above.

Recapping on point 1: Try to avoid divergent statements and recursive algorithms. It's incredibly easy to make a recursive call which causes divergence in the parallel execution. Keep in mind that the recursive algorithms are just a point of view: if you can guarantee non-divergent recursive calls, there is nothing wrong with recursive calls!

Memory alignment

To explain memory alignment I'm going to use an example from raytracing. In order to optimize my path tracer, I had to split the GPU code in different kernels for execution. I will detail the process in the next post. For now, we have to save the ray state in a datastructure as small as possible to avoid high memory latency. This is what I came up with:
struct RayState 
{ 
  Ray ray; // contains position and direction (both 3D vectors)
  float minDist; 
  int triangleID; 
};

The total size of this structure is a simple sum: the amount of floats and integers times their size in bytes. I'm assuming that an integer and float have the same size, because in most compilers they do. With this assumption, in total we have 8 times the size of a float, which is usually 32 bits or 4 bytes.

If you would use this structure to load and save data, there is a small problem: this structure will read in 4 bytes a time, since we did not tell CUDA there is any alignment whatsoever. You can profile this behavior with NSight, which shows the following in memory transactions:


Our tactical choice lead CUDA to read in by the lowest alignment, which is 32 bits. This can be a problem, if you look at this graph:


This was measured for a Tesla C2050, which is a bit outdated by now, but by no means a bad statistic to look at. There is a clear trend showing from this graph: the lower the amount of bits read per transaction, the slower memory access speed. This statement is only true if the amount of threads per multiprocessor is low. This is true in our optimized path tracer, but again, more on this in the next post.

This is where the magic happens. As described in the endless documentation for CUDA (CUDA programming guide), we can declare aligned memory on the device. Which allows us to read our list of structures as an array, if you know the memory size of a single element. We can read our structure as if it is an array of float4 elements (128 bits). The following piece of code does just this:
// Interpret as float4 array, and transform to structure
float4 r1 = ((float4*)rays)[rayidx * 2];
float4 r2 = ((float4*)rays)[rayidx * 2 + 1];
float3 raypos = make_float3(r1.x, r1.y, r1.z);
float3 raydir = make_float3(r1.w, r2.x, r2.y);
float2 data = make_float2(r2.z, r2.w);

I read in two float4 elements from the array by converting the index. This is a simple trick: we know the total size of the structure, which is 256 bits. We are trying to read in 128 bit elements, so the index has to be multiplied by two to get a correct index for a float4. A profiling session now shows the following data:


Which means the data is now read in as aligned 128 bit reads. Mission successful! Recapping on point 2: Keep track of memory alignment for reads and writes of large datasets. We've successfully read in aligned data on the GPU. However, there is room for more memory optimization by using data locality. Since this has already become quite a long post, I will postpone this for another time.

Sources

CUDA programming guide

http://on-demand.gputechconf.com/gtc-xpress/2011/presentations/cuda_webinars_GlobalMemory.pdf